FIP in Baseball Explained: The Pitching Metric That Matters Most
 Pickviz
6 min read
Pickviz
6 min read
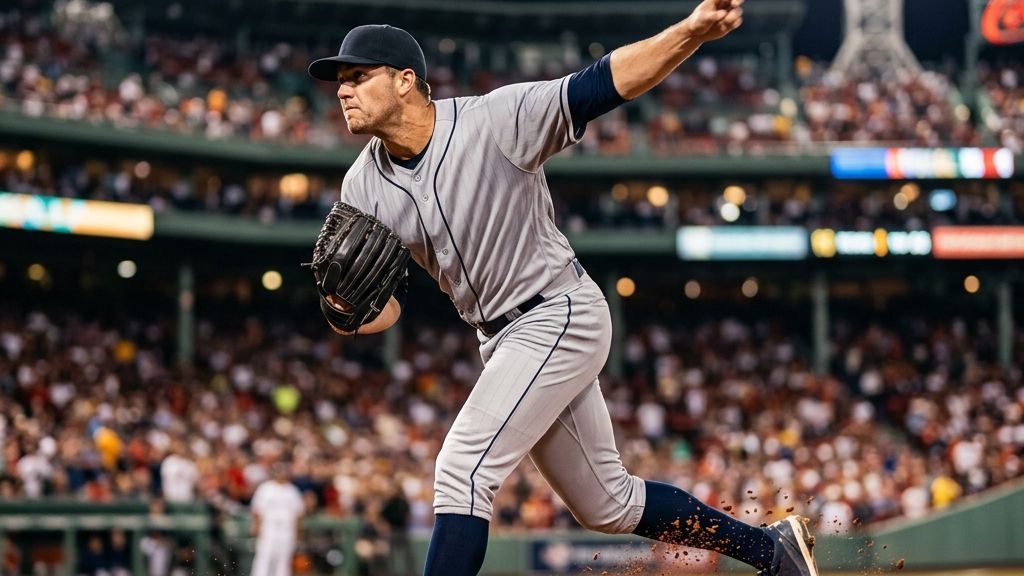
Earned Run Average (ERA) is the most popular pitching statistic in baseball, and it is also the most misleading. For over a century, fans, managers, and sportsbooks judged a pitcher’s quality by how many earned runs they allowed per nine innings. But ERA makes a fundamental error: it attributes everything that happens on the field to the pitcher, ignoring the quality of the defense behind them, the dimensions of the ballpark, and the role of luck.
Fielding Independent Pitching (FIP) fixes this error. By isolating the events a pitcher controls directly, FIP provides a clearer picture of their true performance. For sports analysts and bettors, understanding how FIP works is the key to identifying when a pitcher’s surface-level success is a product of skill or merely a run of good fortune.
The Sabermetric Theory Behind FIP
FIP is built on Defense-Independent Pitching Statistics (DIPS) theory, first proposed by analyst Voros McCracken in 1999. McCracken discovered a statistical reality that shocked the baseball world: pitchers have very little control over what happens to a ball once it is hit into play.
Whether a line drive lands in a defender’s glove or falls for a hit is largely determined by defensive positioning, fielder range, and random variance. Therefore, a metric like ERA—which includes all balls in play—penalizes pitchers for bad defensive plays and rewards them for spectacular ones.
FIP strips away balls in play entirely. It evaluates a pitcher using only the “Three True Outcomes” (strikeouts, walks, and home runs) plus hit-by-pitches. These are the plays where the defense behind the pitcher has zero influence:
- Strikeouts (K): The pitcher dominates the batter without defensive assistance.
- Walks (BB) & Hit-by-Pitches (HBP): The pitcher fails to find the strike zone or hits the batter, putting them on base without defensive involvement.
- Home Runs (HR): Once a ball clears the outfield wall, no defender can make a play on it.
The FIP Formula and Calculation
To make FIP easy to read, the formula scales the result to look exactly like ERA. A FIP of 3.00 is elite, while a FIP of 5.00 is poor.
The mathematical formula is:
$$\text{FIP} = \frac{(13 \times \text{HR}) + (3 \times (\text{BB} + \text{HBP})) – (2 \times \text{K})}{\text{IP}} + C$$
Here is how the components break down:
- 13, 3, and -2 (Weights): These multipliers represent the run-value weight of each event. A home run is highly damaging, so it is weighted at 13. A walk or hit-by-pitch is worth 3, and a strikeout reduces expected runs, so it is weighted at -2.
- IP (Innings Pitched): The total is divided by innings pitched to normalize the stat on a per-inning basis.
- C (The FIP Constant): This is a league-wide constant calculated annually (usually around 3.10 to 3.20). Its sole purpose is to align the league’s total FIP with the league’s total ERA, ensuring the numbers share the same scale.
$$\text{FIP Constant} = \text{League ERA} – \frac{(13 \times \text{League HR}) + (3 \times (\text{League BB} + \text{League HBP})) – (2 \times \text{League K})}{\text{League IP}}$$
FIP vs. ERA: Spotting the Discrepancy
The value of FIP lies in the gap between a pitcher’s FIP and their ERA. When these two numbers diverge, it signals that the pitcher’s ERA is likely to regress toward their FIP over time.
The “Unlucky” Pitcher (ERA > FIP)
If a pitcher has a 4.50 ERA but a 3.20 FIP, their peripheral stats (strikeouts, walks, and home runs allowed) are excellent. However, they are likely suffering from poor defense behind them or bad luck on balls in play (a high BABIP). Over a larger sample size, their ERA is highly likely to drop toward 3.20.
The “Lucky” Pitcher (ERA < FIP)
If a pitcher has a 2.50 ERA but a 3.80 FIP, they are preventing runs on the scoreboard but their underlying metrics are average. They are likely being saved by elite outfield defense or good fortune on batted balls. This pitcher is a prime regression candidate; their ERA is expected to rise toward 3.80.
Consider two elite starters during the 2026 MLB season:
| Pitcher | 2026 ERA | 2026 FIP | Difference | Analytical Outlook |
|---|---|---|---|---|
| Jacob Misiorowski | 1.62 | 2.09 | -0.47 | Elite performance, but slight upward ERA regression expected. |
| Tarik Skubal | 3.09 | 3.06 | +0.03 | Highly stable profile; ERA perfectly reflects underlying skill. |
Source: FanGraphs player statistics, as of July 19, 2026.
A pitcher like Jacob Misiorowski, whose breakout season is built on extreme velocity and pitch-mix changes, shows how a dominant starter can run an ERA lower than their FIP. Misiorowski’s 1.62 ERA is supported by a 2.09 FIP—indicating that while he has been historically effective, he has also benefited from favorable outcomes on balls in play.
Conversely, Tarik Skubal’s steady performance profile is highlighted by a near-identical 3.09 ERA and 3.06 FIP. This tells front offices and bettors that Skubal is not relying on luck or defense; his surface stats are a true reflection of his ability to dominate the strike zone.

How to Use FIP for Sports Betting
FIP is one of the most powerful tools for finding value in MLB betting lines, particularly in match result (moneyline) and first-five-innings markets.
1. Betting the Regression
When two pitchers face off, compare their ERA-FIP differentials. If a “lucky” pitcher (low ERA, high FIP) is favored against an “unlucky” pitcher (high ERA, low FIP), the moneyline odds will often favor the wrong team. Sportsbooks price games heavily based on team record and ERA. Betting on the team with the superior FIP pitcher provides a statistical edge over the market.
2. Live and In-Play Adjustments
Traditional box scores show a pitcher who has allowed three runs on five hits over four innings as struggling. However, if those hits were weak singles and the pitcher has struck out six with zero walks, their FIP for the game is excellent. Identifying when a pitcher is throwing well despite bad run-results allows live bettors to back them at plus-money before the game stabilizes.
3. Understanding the Limitations
FIP is not perfect. Because it ignores balls in play, it does not account for a pitcher’s ability to induce weak contact. Ground-ball specialists who consistently generate soft contact can sustain an ERA below their FIP for their entire careers.
Bettor’s Note: When evaluating pitch-to-contact starters, look at advanced metrics like SIERA (Skill-Interactive Earned Run Average) or xFIP (which normalizes home-run-to-fly-ball ratios) to supplement your FIP analysis.
The Real Takeaway
Fielding Independent Pitching strips away the noise of baseball to isolate a pitcher’s core capabilities. It turns a chaotic game of bounces, wind, and defender range into a clean evaluation of strikeouts, walks, and home runs.
FIP is not a guarantee of future performance, nor does it discount the value of a great defense. But for anyone looking to model baseball outcomes, build projection systems, or place informed wagers, FIP is the baseline metric that separates true pitching talent from statistical noise.
Frequently Asked Questions
What is a good FIP in baseball?
A FIP of 3.00 or lower is considered elite, representing an All-Star or Cy Young-caliber pitcher. A FIP between 3.50 and 4.00 is above average, while anything above 4.50 is below average for a major league starter.
Why is FIP better than ERA?
FIP is better than ERA for predictive modeling because it removes factors a pitcher cannot control, such as defensive quality, luck on balls in play, and stadium dimensions. This makes FIP a more stable and reliable indicator of a pitcher’s actual skill level.
Does FIP account for home runs?
Yes. FIP includes home runs because once a ball leaves the playing field, the defense has no ability to make a play on it. However, because home-run-to-fly-ball rates can be volatile, some analysts prefer xFIP, which replaces a pitcher’s actual home run rate with the league average rate.