fWAR vs bWAR: Demystifying Sabermetric Wins Above Replacement
 Pickviz
8 min read
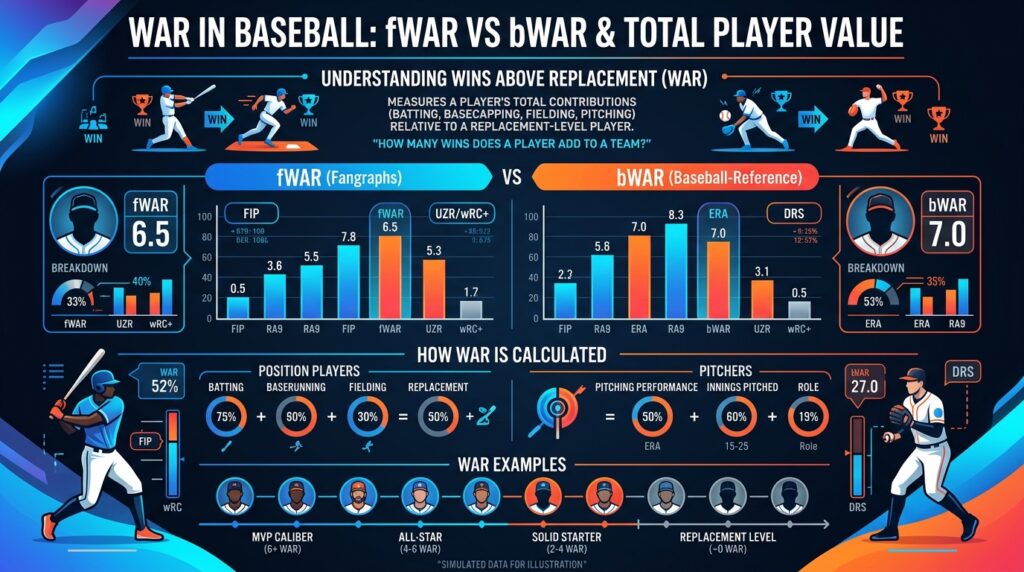
In modern Major League Baseball analytics, traditional box scores fail to capture holistic player contributions. The evolution of sabermetrics birthed Wins Above Replacement (WAR)—an all-encompassing metric designed to quantify a player’s total value to their team’s win column relative to a freely available replacement-level athlete (typically a triple-A call-up or fringe bench player). However, two distinct primary models dominate the sports analytics landscape: FanGraphs WAR (fWAR) and Baseball-Reference WAR (bWAR, often designated as rWAR). While both models seek to measure the exact same theoretical outcome, their underlying architectural choices—particularly regarding defensive evaluation and pitching inputs—create substantial divergences in player valuation.
Key Takeaways
- Theoretical Objective: Both fWAR and bWAR scale player contributions to a baseline where a team of 0.0 WAR players would produce a .294 winning percentage (47 wins in a 162-game season).
- Position Player Divergence: fWAR relies on Statcast’s Outs Above Average (OAA) and Ultimate Zone Rating (UZR), whereas bWAR uses Sports Info Solutions’ Defensive Runs Saved (DRS).
- Pitcher Evaluation Rift: fWAR utilizes Fielding Independent Pitching (FIP), measuring a pitcher’s isolated skill. bWAR uses Runs Allowed per 9 innings (RA9), adjusting for the defensive efficiency of the team behind them.
- Run-to-Win Conversion: Approximately 9 to 10 runs added or prevented equal 1 Win Above Replacement, dependent on the run environment of the specific MLB season.
The Foundational Mechanics: What is Replacement Level?
Before analyzing the operational variance between fWAR and bWAR, establishing the theoretical baseline is required. A “replacement-level” player is not an average player; an average MLB player typically produces between 2.0 and 2.5 WAR per 600 plate appearances. Replacement level represents the performance threshold of a player readily obtainable for the league minimum salary (e.g., minor league depth or waiver wire claims).
By setting replacement level at a .294 winning percentage across a full MLB league environment (1,000 total WAR distributed across MLB per 162-game season), the metric establishes a standardized financial and tactical benchmark. In modern free agency economics, 1.0 WAR fluctuates in market value between $8 million and $10 million.
WAR = (Batting Runs + Baserunning Runs + Fielding Runs + Positional Adjustment + League Adjustment + Replacement Runs) / Runs Per Win
The Runs Per Win (RPW) factor dynamically recalibrates every season based on league-wide scoring. In a high-scoring era (e.g., 2019), RPW increases (~10.2 runs/win), meaning more runs are required to secure an additional win. In a pitcher-friendly era, RPW decreases (~9.1 runs/win).
Evaluating Position Players: fWAR vs. bWAR
For position players, both models use Weighted On-Base Average (wOBA) scaled to Weighted Runs Above Average (wRAA) as the primary offensive engine. The primary divergence lies in how defensive performance and park factors are ingested and weighted.
1. Offensive Value & Park Factors
Offensively, both platforms evaluate every plate appearance using linear weights assigned to specific outcomes (singles, doubles, triples, home runs, walks, hit-by-pitches). The absolute value of a walk varies yearly based on league run environments, calculated via the Tango distribution model.
However, park factor adjustments differ. bWAR utilizes multi-year run-based park factors provided by Baseball-Reference, whereas fWAR incorporates FanGraphs’ park factors, which isolate specific component impacts (e.g., right-handed home run factor vs. overall run factor).
2. The Defensive Variance: DRS vs. OAA/UZR
Defensive metrics represent the volatile variable in position player WAR. A single season of defensive data contains inherent noise, and the choice of defensive metric frequently drives discrepancies between fWAR and bWAR.
- bWAR (Baseball-Reference): Employs Defensive Runs Saved (DRS) calculated by Sports Info Solutions. DRS measures a fielder’s performance by dividing the field into detailed zones and comparing play outcomes against historical averages for balls hit to those coordinates with similar velocity and launch angles.
- fWAR (FanGraphs): Historically utilized Ultimate Zone Rating (UZR), but transitioned to Statcast’s Outs Above Average (OAA) for infield and outfield defense, supplemented by catcher framing models from Statcast. OAA tracks exact fielder positioning, distance covered, and exit velocity/launch angle via optical tracking.
| Metric Component | FanGraphs WAR (fWAR) | Baseball-Reference WAR (bWAR) |
|---|---|---|
| Offensive Basis | wOBA / wRC+ (Weighted Runs Created Plus) | wOBA / wRAA (Adjusted for park/league) |
| Defensive Basis | Outs Above Average (OAA) & Statcast Framing | Defensive Runs Saved (DRS) via SIS |
| Baserunning Metric | BsR (Ultimate Base Running + Weighted Stolen Bases) | Rbaser (Runs Above Avg via base advancement) |
| Pitcher Foundation | FIP (Fielding Independent Pitching) | RA9 (Runs Allowed per 9) + Defensive Adjustment |
| Catcher Framing | Fully integrated into historical & modern fWAR | Excluded from core bWAR calculation |
Pitcher Valuation: The Fundamental Philosophical Divide
The divergence between fWAR and bWAR is most pronounced when evaluating pitchers. This stems from a core debate in sabermetric philosophy: Should a metric evaluate what a pitcher IS RESPONSIBLE FOR independently, or what ACTUALLY HAPPENED on the field?
fWAR: Predictive and Independent Performance (FIP)
FanGraphs anchors its pitcher WAR to Fielding Independent Pitching (FIP). The premise of FIP is that pitchers have minimal, non-repeatable control over the outcome of balls put into play (BABIP). Therefore, fWAR strips away defense and evaluates only events a pitcher controls directly: Strikeouts (K), Walks (BB), Hit By Pitches (HBP), and Home Runs allowed (HR).
FIP = ((13 * HR) + (3 * (BB + HBP)) – (2 * K)) / Innings Pitched + FIP_Constant
A pitcher with a high ERA due to poor team defense will not be penalized in fWAR. If his FIP is elite, his fWAR will remain exceptionally high.
bWAR: Descriptive and Contextual Reality (RA9)
Baseball-Reference takes an outcome-based, descriptive approach. bWAR begins with actual Runs Allowed per 9 innings (RA9), which includes earned and unearned runs. Because unearned runs still impact game results, bWAR counts them, but adjusts for the defensive strength of the pitcher’s team.
To isolate the pitcher’s contribution, bWAR subtracts the expected run suppression provided by the team’s defense behind them (RA9def). If a pitcher plays in front of a sub-par defense (-50 DRS team), bWAR grants the pitcher credit for runs allowed that were attributable to poor fielding.
In 2018, Philadelphia Phillies starter Aaron Nola produced one of the most divergent pitch valuations in modern analytics history:
• bWAR: 10.5 (Ranked #1 in MLB)
• fWAR: 5.4 (Ranked #8 in MLB)
The Cause: The 2018 Phillies defense was historically inefficient, recording -109 Defensive Runs Saved. bWAR concluded Nola’s 2.37 ERA in front of an abysmal defense was superhuman, awarding him massive defensive adjustment points. fWAR, relying on Nola’s 3.01 FIP, measured his true isolated peripherals without inflating value for team defense penalties.
Step-by-Step Calculation Walkthrough: Position Player
To understand how raw metrics translate into final WAR values, examine this step-by-step mathematical path for a hypothetical elite center fielder over a 650 Plate Appearance (PA) season:
1. Calculate Offensive Contribution (wRAA)
Assume the player logs a .380 wOBA in a league where the average wOBA is .315 and the wOBA Scale factor is 1.15:
wRAA = ((0.380 – 0.315) / 1.15) * 650 = +36.73 Runs
2. Add Baserunning (BsR) & Defense (OAA/DRS)
Add calculated baserunning value (+4.0 runs) and elite center field defensive performance (+12.0 runs):
3. Apply Positional Adjustment
Positional adjustments normalize defensive difficulty across the field over a full 1,458-inning season (Center Field = +2.5 runs, Shortstop = +7.5 runs, First Base = -12.5 runs, Designated Hitter = -17.5 runs):
4. Add Replacement Level Baseline & Divide by RPW
Replacement level adds approximately 20 runs per 600 PA baseline. Assuming 650 PA, replacement value equates to +21.6 runs. Assume a RPW conversion factor of 10.0:
Final WAR = 76.83 / 10.0 = 7.68 WAR (MVP Candidate)
Scale of Player Value
Understanding single-season WAR targets allows data analysts to categorize player performance cleanly:
- 0.0 – 0.9 WAR: Replacement level / Minor League depth
- 1.0 – 1.9 WAR: Roster bench player / Platoon starter
- 2.0 – 2.9 WAR: Average MLB starter
- 3.0 – 3.9 WAR: Above-average starter
- 4.0 – 4.9 WAR: All-Star caliber performance
- 5.0 – 5.9 WAR: Elite All-Star / Fringe MVP candidate
- 6.0+ WAR: MVP / Supereminent season
Evaluating Analytical Limitations and Next-Gen Value Metrics
While WAR serves as an effective single-number summary metric, advanced front offices do not rely on it blindly. Several structural limitations require domain awareness:
- Knock-on Framing Artifacts: Pitcher bWAR historically ignored catcher framing effects. A pitcher throwing to an elite framing catcher (e.g., Jose Trevino) receives artificially elevated bWAR due to extra strikes created by the catcher, whereas fWAR decouples pitch-framing credit to the backstop.
- Batted Ball Profiling: FIP-based fWAR assumes all pitchers share identical non-strikeout skill profiles. However, elite soft-contact generators (e.g., Framber Valdez, Corbin Burnes) systematically suppress exit velocity and maintain lower BABIPs over large sample sizes. fWAR under-evaluates these profile archetypes compared to bWAR.
- Defensive Metric Volatility: Single-season defensive metrics require a wide confidence interval (+/- 5 to 8 runs). Small sample sizes in field coverage metrics can skew a player’s WAR by up to 0.8 wins in a single season.
The next frontier of value metrics focuses on integrating micro-transactional Statcast data directly into WAR frameworks. Expected Weighted On-Base Average (xWOBA)—which substitutes actual outcomes with batted-ball velocity and launch-angle expectations—is increasingly integrated into proprietary team-internal WAR metrics to filter out luck components completely.
Analytical Questions & Answers
FAQ: fWAR vs bWAR Nuances
Why do fWAR and bWAR disagree more on pitchers than on position players?
fWAR evaluates pitchers using FIP (evaluating only strikeouts, walks, and home runs allowed), operating under the premise that pitchers do not control contact outcome variance. bWAR evaluates pitchers using actual Runs Allowed per 9 innings (RA9) and applies a post-hoc correction based on the team’s overall defensive run suppression. This fundamental difference in philosophy creates wide divergences when pitching behind extreme (good or bad) defenses.
Is fWAR or bWAR more accurate for predicting future performance?
fWAR is demonstrably more predictive for pitchers over subsequent seasons because FIP correlates higher year-over-year than RA9 or ERA. For position players, both metrics display strong predictive validity, though fWAR’s reliance on Statcast OAA provides a slightly cleaner signal for fielding evaluation than legacy DRS models.
How does WAR handle position switches during a single season?
WAR calculates positional adjustments on an inning-by-inning basis. If a player plays 500 innings at Shortstop (+7.5 runs/1458 innings rate) and 500 innings at First Base (-12.5 runs/1458 innings rate), the mathematical model applies the exact prorated positional factor for the precise time spent at each defensive position.
Does WAR factor in leverage or clutch situations?
Standard fWAR and bWAR are context-neutral metrics. A home run hit in the bottom of the 9th inning down by one run yields the exact same WAR credit as a home run hit in the 3rd inning of a 10-0 blowout. For context-dependent analysis measuring game leverage, sabermetricians utilize Win Probability Added (WPA) or Leverage-Index-adjusted metrics.