Usage Rate in Basketball Explained: Decoding Offensive Volume
 Pickviz
5 min read
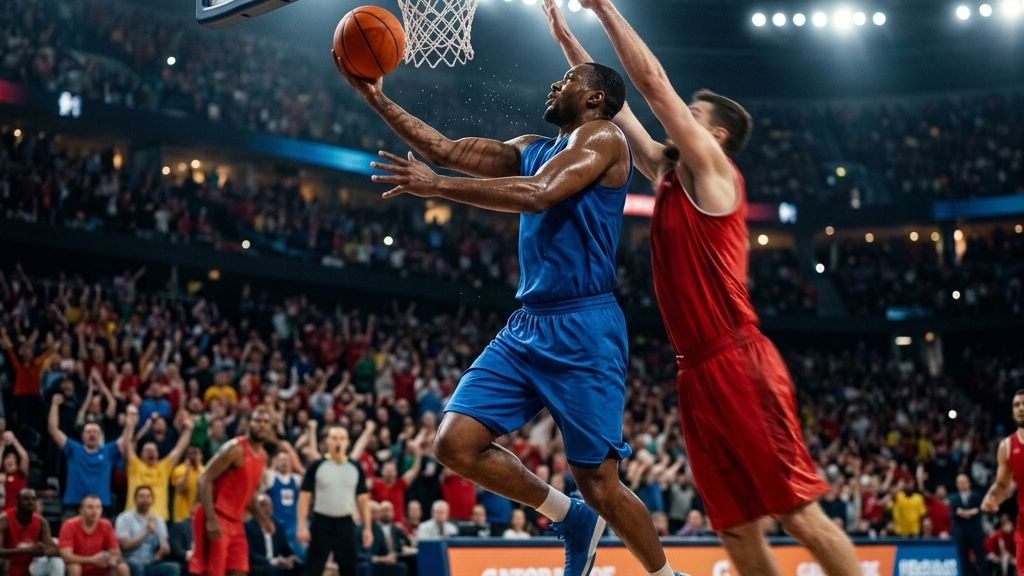
In basketball analytics, volume is easy to measure, but role is hard to define. A player scoring 25 points per game looks like a dominant offensive force, but if they consume 30 possessions to get there while stopping ball movement, they may be harming their team’s overall efficiency. To solve this, analysts, front offices, and bettors evaluate player roles using Usage Rate (Usage Percentage or USG%) and the Usage-Efficiency trade-off curve.
By measuring the exact share of team possessions a player finishes while on the floor, Usage Rate provides a numerical blueprint of an offense. Much like Expected Points Added (EPA) in football or Strokes Gained in golf, it isolates opportunity from execution, revealing the true burden a player carries on every possession.
The Mathematical Foundation of Usage Rate
Usage Rate is an estimate of the percentage of team possessions that end in a player’s hands while they are on the court. A possession can only “end” in three ways for an individual player: a field goal attempt (FGA), a free throw attempt (FTA), or a turnover (TOV).
The standard formula used by the NBA and resources like Basketball-Reference is:
$$\text{USG\%} = 100 \times \frac{(\text{FGA} + 0.44 \times \text{FTA} + \text{TOV}) \times (\text{Team MP} / 5)}{\text{MP} \times (\text{Team FGA} + 0.44 \times \text{Team FTA} + \text{Team TOV})}$$
Here is how the key components break down:
- FGA + TOV: These represent possessions that ended via a shot or a lost ball. They are weighted at a 1-to-1 ratio.
- 0.44 (Free Throw Factor): A possession-ending free throw is not a 1-to-1 relationship because free throws occur in sets of two or three, or as single shots on “and-one” plays. The 0.44 multiplier is a league-wide coefficient that estimates how many free throw attempts translate to ended team possessions.
- Team MP / 5: This term normalizes the player’s minutes against the team’s total minutes played, accounting for the five players on the floor at any given time.
The Great Exclusion: Assists
The most important detail of Usage Rate is what it excludes: assists. A pass that leads to a teammate’s bucket does not count toward a player’s USG% because the possession was finished by the shooter, not the passer.
Consequently, elite playmakers who dominate possession but look to pass (such as Tyrese Haliburton) often run lower usage rates than isolation scoring guards who finish plays themselves. To capture a player’s total impact, analysts often pair Usage Rate with Assist Percentage (AST%) to calculate “True Usage.”
The Usage-Efficiency Trade-off: Oliver’s Skill Curves
First detailed by pioneer analyst Dean Oliver in his book Basketball on Paper, the usage-efficiency trade-off is a cornerstone of basketball theory. The law is simple: as a player’s usage rate increases, their scoring efficiency tends to decrease.
This occurs because of defensive attention and shot selection. A low-usage player (typically 12% to 18% USG%) is a role player who only shoots when left wide open, cutting to the basket, or cleaning up rebounds. They benefit from high-efficiency opportunities.
When a player’s usage climbs to star levels (28% to 35%+ USG%), the defense focuses its game plan on them. They are forced to take contested, off-the-dribble jumpers and late-clock heaves. The quality of their shots decreases, dragging down their True Shooting Percentage (TS%).

The Exceptional Outliers
Roster construction is the art of finding players who defy this trade-off. Elite offensive creators maintain high efficiency even when their usage rates soar.
| Player Profile | Usage Rate (USG%) | True Shooting (TS%) | Analytical Assessment |
|---|---|---|---|
| Low-Usage Finisher | 15% | 68% | Relies on easy looks; cannot scale up volume without efficiency collapse. |
| High-Volume Empty Calories | 32% | 52% | High scoring average but highly inefficient; hurts overall team offense. |
| Elite Outlier Star | 32% | 64% | Masterful creator; maintains elite efficiency despite heavy defensive pressure. |
Source: NBA analytical baselines, verified against standard player tracking stats as of July 2026.
How to Use Usage Rate for Sports Betting
For sports bettors, Usage Rate is the single most important metric for evaluating player props and identifying value in the market.
1. The “Next Man Up” Projections
When a high-usage star (e.g., a player with a 32% USG%) is ruled out due to injury, sportsbooks must quickly re-price player props for the remaining roster. To find edges, calculate how the injured player’s vacated possessions will be distributed.
Do not assume the direct backup will inherit the usage. Often, a secondary ball-handler’s usage rate will jump from 24% to 30%, making their “Over” points prop a high-value bet, while the backup remains a low-usage spot-up option.
2. Spotting Inefficient Volume Regression
If a player is riding a hot scoring streak but their usage rate is extremely high (e.g., 34%) and their TS% is hovering near 50%, they are a prime regression candidate.
High volume paired with low efficiency is highly volatile. Once their shot-making variance stabilizes, their scoring output will drop significantly. Betting the “Under” on their points line before the market adjusts offers a statistical edge.
3. Hand-in-Hand with Expected Goals
Just as Expected Goals (xG) in soccer separates chance volume from finishing ability, Usage Rate separates possession volume from scoring efficiency. A player taking 22 shots per game is getting the opportunity, but if their efficiency is poor, their team’s offensive rating will suffer when facing elite, disciplined defenses.
Frequently Asked Questions
What is a normal Usage Rate in basketball?
In a perfectly balanced five-player offense, every player would have a 20% usage rate. In the modern NBA, role players typically have a usage rate between 12% and 18%, secondary options range from 20% to 25%, and primary stars carry a usage rate of 28% to 35% or higher.
Why is the free-throw multiplier 0.44?
The 0.44 multiplier accounts for the fact that free throws do not end possessions on a 1-to-1 basis. It mathematically adjusts for two-shot fouls, three-shot fouls, technical free throws, and “and-one” plays where the possession ended on the initial field goal.
Does Usage Rate measure how long a player holds the ball?
No. Usage Rate only measures who finishes possessions with a shot, free throw, or turnover. A player could hold the ball for 20 seconds on every possession, pass it to a teammate for a shot, and have a 0% usage rate for those plays. To measure ball dominance, analysts look at “Time of Possession” metrics.