NBA Player Efficiency Rating Explained: Formula & Usage
 Pickviz
7 min read
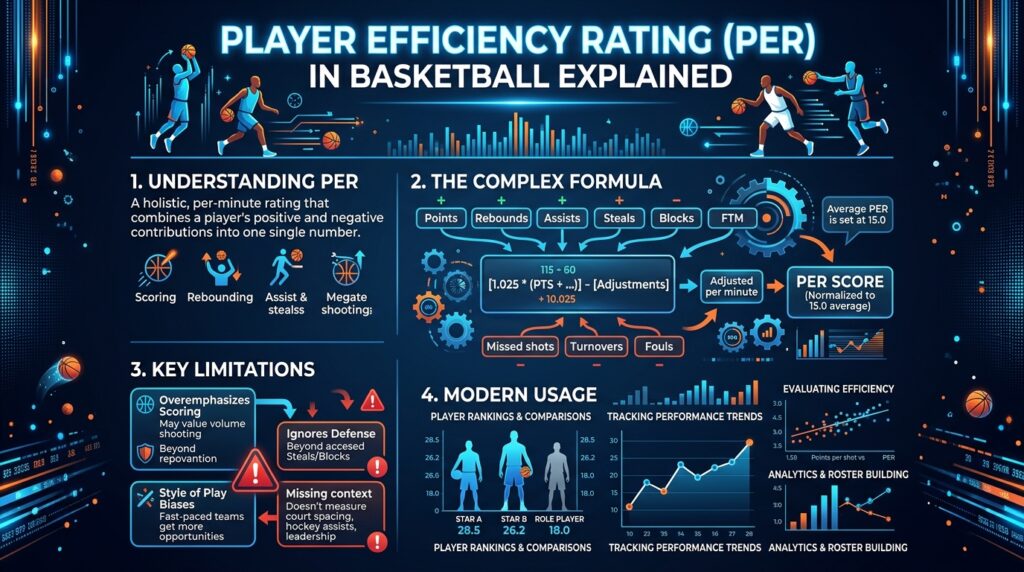
Engineered by former ESPN analyst and Memphis Grizzlies Vice President of Basketball Operations John Hollinger in the early 2000s, Player Efficiency Rating (PER) represents a landmark milestone in basketball analytics. As the NBA’s first widely accepted per-minute, pace-adjusted composite metric, PER transformed how front offices, media, and analysts evaluate single-season individual productivity by collapsing every box-score stat into a unified rating calibrated around a league average of 15.0.
Key Analytical Takeaways
- Standardized Baseline: PER is normalized every season so that the league-wide average always equals exactly 15.0.
- Per-Minute & Pace-Adjusted: By evaluating stats on a per-minute basis and adjusting for team pace, PER standardizes comparisons across fast and slow offensive systems.
- Positive vs. Negative Weights: Positive box-score actions (made shots, rebounds, assists, steals, blocks) add value, while negative events (missed shots, turnovers, personal fouls) penalize a player’s score.
- Systemic Blindspots: PER heavily rewards scoring volume and individual box-score defensive events, but fails to capture off-ball defensive impact, rotational coverage, and spatial leverage.
The Mathematical Architecture of PER
PER is not a single simple equation; it is a multi-layered mathematical pipeline requiring three sequential phases: Unadjusted PER (uPER), Pace Adjustment, and League Normalization. Understanding the metric requires dissecting each phase precisely.
Phase 1: Unadjusted PER (uPER)
The foundation of PER is uPER, which calculates a raw efficiency score using specific weights derived from league-wide context vectors. It balances positive contributions against negative box-score plays, incorporating constants like the Value of a Possession (VOP) and Defensive Rebound Percentage (DRB%).
To compute uPER, several intermediate league-wide values must first be derived:
- Value of a Possession (VOP): Defined as
lgPTS / (lgFGA - lgORB + lgTOV + 0.44 * lgFTA). This assigns an exact point value to giving away or gaining a possession. - Factor: Derived as
(2 / 3) - (0.5 * (lgAST / lgFGM)) / (2 * (lgPTS / lgFGA)). This balances the value of assisted versus unassisted field goals. - Defensive Rebound Percentage (DRB%): Calculated as
(lgTRB - lgORB) / lgTRB.
Phase 2: Team Pace Adjustment
Because players on fast-paced teams naturally accumulate more box-score counting stats than those on slow-paced teams, uPER must be adjusted for pace. The formula scales the player’s uPER against their team’s pace relative to the league average:
Phase 3: League Normalization
To enable cross-era comparisons, the final PER is scaled so that the league average aPER in any given season equals exactly 15.0:
Interpreting PER Ratings
Because PER is explicitly anchored at a league average of 15.0, Hollinger established a standardized tiers reference framework to evaluate single-season performances:
| PER Range | Performance Classification | Historical Benchmarks / Examples |
|---|---|---|
| 30.0+ | All-Time Historic Season | Nikola Jokić (32.85, 2021-22), Giannis Antetokounmpo (31.86, 2019-20), Michael Jordan (31.71, 1987-88) |
| 25.0 – 29.9 | MVP Candidate | Joel Embiid, Luka Dončić, LeBron James (Peak Years) |
| 22.5 – 24.9 | All-Star / Franchise Pillar | Anthony Davis, Jayson Tatum, Donovan Mitchell |
| 20.0 – 22.4 | Borderline All-Star / High-Usage Option | Primary secondary scorers and elite high-efficiency starters |
| 16.5 – 19.9 | Solid Second / Third Option | Above-average starting role players |
| 15.0 | League Average Player | Standard NBA rotation starter / key reserve |
| 13.0 – 14.9 | Rotation Reserve | Bench contributors, specialized role players |
| < 11.0 | Fringe / End-of-Bench | Deep bench reserves, replacement-level talent |
The highest single-season PER in NBA history, set by Denver Nuggets center Nikola Jokić during the 2021-22 NBA season, surpassing Giannis Antetokounmpo (31.86 in 2019-20) and Wilt Chamberlain (31.82 in 1962-63).
Analytical Case Studies: Successes and Structural Anomaly
1. Nikola Jokić (2021-22): The Pinnacle of Offensive Efficiency
During the 2021-22 campaign, Nikola Jokić posted a record 32.85 PER. Jokić averaged 27.1 points, 13.8 rebounds, and 7.9 assists per game while maintaining a 58.3% Field Goal percentage and a 66.1% True Shooting percentage. PER heavily rewards players who accumulate assists and defensive rebounds from frontcourt positions while minimizing missed field goals, making Jokić’s profile mathematically ideal for maximum PER optimization.
2. The Boban Marjanović Paradox: Small-Sample Distortion
Because PER is calculated strictly on a per-minute basis, players who maintain exceptional efficiency in limited minutes generate wildly inflated scores. Center Boban Marjanović regularly posted single-season PERs between 26.0 and 29.5 during his career—placing his career per-minute efficiency on par with MVP winners—despite playing under 12 minutes per game. High offensive rebound rates, efficient putback scoring, and minimal long-range shot attempts inflate uPER over small sample sizes, highlighting PER’s inability to account for stamina, conditioning, or opponent defensive adjustments over heavy minutes.
Critical Technical Limitations of PER
While PER represented a major leap forward in the early analytics era, contemporary sports data engineers recognize several core mathematical and conceptual flaws that reduce its diagnostic value today.
1. Heavy Volume Incentivization and Shot-Threshold Flaws
Mathematical evaluations of Hollinger’s formula reveal that a player gains net PER points on field goal attempts whenever their True Shooting percentage exceeds a relatively low threshold (~30-35%). Consequently, high-volume shooters who take inefficient shots can actually boost their PER over passive players who take fewer, higher-efficiency shots, provided they gather rebounds or draw fouls at modest rates.
2. Defensive Blindspots
PER measures defense strictly through box-score events: steals, blocks, and defensive rebounds. It completely misses vital defensive contributions such as:
- Individual isolation defense and point-of-attack containment.
- Pick-and-roll coverage execution and rotational help.
- Contesting shots without registering a block.
- Defensive communication and screen-navigation effort.
As a result, elite perimeter lock-down defenders (e.g., Alex Caruso, Jrue Holiday) often receive below-average defensive value in PER, while gamble-heavy defenders who rack up steals or blocks are over-rewarded.
3. Positional Bias Toward Bigs
Due to high field-goal percentages, high rebound rates, and rim-protection blocks, dominant big men naturally skew higher in PER than elite perimeter creators. Rebounds are weighted heavily in the uPER formula, inflating values for centers while under-crediting perimeter gravity, off-ball movement, and floor spacing provided by high-volume three-point shooters.
PER in Modern Front Office Analytics
Modern NBA front offices no longer use PER as a primary evaluation tool. Instead, advanced analytics departments treat PER as a legacy aggregate metric, replacing or supplementing it with tracking-data-driven and play-by-play impact metrics.
| Metric Name | Primary Data Inputs | Defensive Capture Quality | Primary Modern Use Case |
|---|---|---|---|
| PER (Player Efficiency Rating) | Box Score Stats + Minutes + Team/League Pace | Poor (Steals, Blocks, Rebounds only) | Historical era benchmarking & quick box-score summary |
| BPM (Box Plus-Minus 2.0) | Box Score Stats + Team Efficiency Ratings | Moderate (Position-adjusted regression) | Public box-score estimation of point differential impact |
| EPM (Estimated Plus-Minus) | Play-by-Play Lineup Data + Player Tracking Data | High (Incorporates tracking & lineup impact) | Current gold standard for public impact evaluation |
| RAPM (Regularized Adjusted Plus-Minus) | Pure Play-by-Play Lineup Stints (Ridge Regression) | Very High (Isolates individual lineup impact) | Removing box-score bias to evaluate true point differential |
While metrics like Estimated Plus-Minus (EPM), DARKO, and RAPM offer superior predictive and diagnostic clarity, PER remains valuable as a historical baseline. It isolates raw per-minute production across eras with unprecedented computational simplicity, preserving its status as a foundational building block in the history of basketball analytics.
Frequently Asked Questions
What is a good PER in the NBA?
An average NBA player scores exactly 15.0 PER in any given season due to formula normalization. A PER of 20.0 or higher denotes border-line All-Star caliber play, 25.0 indicates an MVP candidate, and seasons above 30.0 represent historic individual performances.
How does PER handle defense?
PER accounts for defense solely through traditional box-score counting statistics: defensive rebounds, steals, and blocked shots. It does not factor in spatial tracking, contested shot percentages, switchability, defensive positioning, or team defensive rating while the player is on the court.
Why do centers often have higher PERs than point guards?
The mathematical weighting in uPER awards significant value to high field-goal percentages and defensive/offensive rebound rates. Centers shoot higher percentages closer to the rim and collect rebounds at much higher frequencies than point guards, giving them a structural advantage in raw uPER generation.
What is the difference between PER and True Shooting Percentage (TS%)?
True Shooting Percentage (TS%) is a dedicated efficiency metric that measures scoring efficiency by accounting for two-point field goals, three-point field goals, and free throws. PER, by contrast, is a composite metric that combines scoring, passing, rebounding, steals, blocks, turnovers, fouls, and pace into an overall rating.