World Cup 2026 Final: What AI Predictions and xG Analytics Say About Argentina vs Spain
 Pickviz
7 min read
Pickviz
7 min read
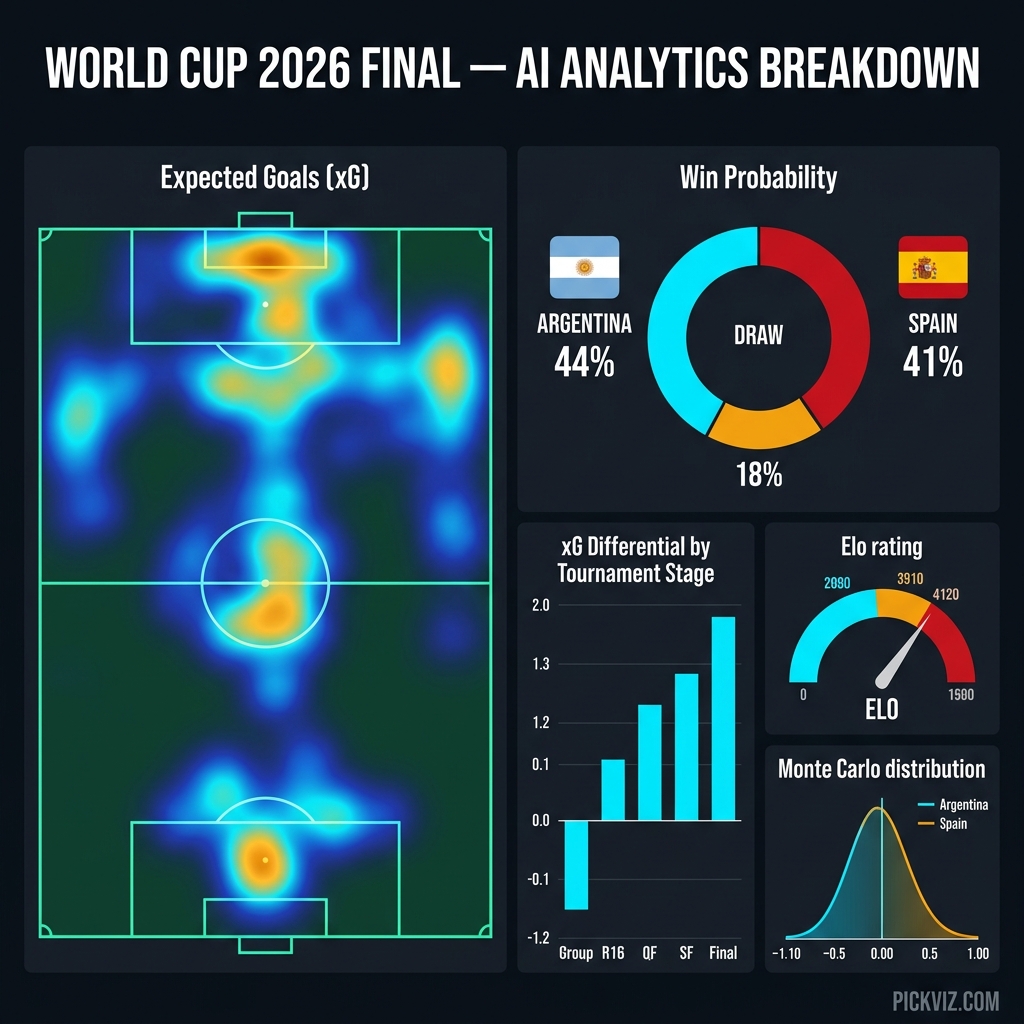
How AI Predictions and xG Analytics Are Shaping the World Cup 2026 Final
The World Cup 2026 final between Argentina and Spain isn’t just the biggest football match in four years — it’s become the highest-stakes test of predictive analytics in sports history. Dozens of AI models, Monte Carlo simulators, and expected goals engines ran millions of simulations to get here, and their track record this tournament has been genuinely impressive. But what does the data actually say about Sunday’s final, and how do everyday fans cut through the noise to find the real value hidden inside these models?
Let’s break it down.
What the AI Models Got Right (and Where They Diverged)
Going into the knockout rounds, nine leading AI systems — including Gemini, Claude, ChatGPT, Grok, and DeepSeek — were split on the eventual champion but unanimous on one thing: France, Argentina, Spain, and England would form the final four. They were right on all four counts.
Where the models diverged was instructive. Gemini and Le Chat backed France as the outright favorite, weighting their squad depth and defensive structure heavily. ChatGPT and Claude favored Argentina, leaning on their perfect tournament run and Lionel Messi’s historical pattern of elevating under pressure.
Spain’s route to the final was the biggest vindication of a different kind of data model — tactical structure analysis. While xG-based Elo models rated them slightly below France, systems that weighted possession sequencing, pressing efficiency, and set-piece organization consistently flagged Spain as structurally dangerous. Those models aged well.
Argentina’s comeback against England (trailing 1-0, scoring twice in the final five minutes through Enzo Fernández and Lautaro Martínez) is the kind of result that exposes the core limitation of any static prediction model: tournament football is non-linear. A Poisson distribution can give you a 72% win probability, but it cannot tell you that Lautaro hits the bar in the 84th minute and the rebound falls to Enzo.
How AI Predictions and xG Analytics Are Shaping the World Cup 2026 Final
The World Cup 2026 final between Argentina and Spain isn’t just the biggest football match in four years — it’s become the highest-stakes test of predictive analytics in sports history. Dozens of AI models, Monte Carlo simulators, and expected goals engines ran millions of simulations to get here, and their track record this tournament has been genuinely impressive. But what does the data actually say about Sunday’s final, and how do everyday fans cut through the noise to find the real value hidden inside these models?
Let’s break it down.
What the AI Models Got Right (and Where They Diverged)
Going into the knockout rounds, nine leading AI systems — including Gemini, Claude, ChatGPT, Grok, and DeepSeek — were split on the outright champion but unanimous on one thing: France, Argentina, Spain, and England would form the final four. They were right on all four counts.
Where the models diverged was instructive. Gemini and Le Chat backed France as the outright favorite, weighting their squad depth and defensive structure heavily. ChatGPT and Claude favored Argentina, leaning on their perfect tournament run and Lionel Messi’s historical pattern of elevating under pressure.
Spain’s route to the final was the biggest vindication of a different kind of data model — tactical structure analysis. While xG-based Elo models rated them slightly below France, systems that weighted possession sequencing, pressing efficiency, and set-piece organization consistently flagged Spain as structurally dangerous. Those models aged well.
Understanding the Core Models: xG, Monte Carlo, and Elo
To understand what analysts are actually measuring, you need to know how these three frameworks interact.
Expected Goals (xG) assigns a probability score to every shot based on shot location, angle, assist type, and defensive pressure. A shot from six yards out with no defender between the shooter and keeper might carry an xG of 0.82. A long-range strike from 30 yards gets 0.04. Aggregate xG across a tournament tells you whether a team is winning games via clinical execution or simply being lucky with shot quality.
Monte Carlo Simulations take team strength ratings (often Elo-based) and simulate the entire tournament thousands of times — sometimes 100,000+ iterations. The output is a probability distribution: “Argentina wins the World Cup in 23% of simulations.” These simulations are best used as a range-of-outcomes tool, not a point forecast.
Elo Ratings are the foundation most models build on. Adapted from chess, they update a team’s power rating based on match results, weighted by opponent strength and match importance. A win against England in a World Cup semifinal bumps a team’s Elo far more than a friendly against a minnow.
The most sophisticated models in 2026 — such as those built on the Dixon-Coles framework — combined all three: Elo-adjusted attack/defense ratings fed into a bivariate Poisson distribution, then simulated via Monte Carlo across the bracket.
The Final: Spain vs. Argentina — What the Data Says
Here’s where the models currently stand heading into Sunday’s final at MetLife Stadium:
| Model / Source | Argentina Win % | Spain Win % | Draw (AET/PKs) |
|---|---|---|---|
| Opta Supercomputer | 38% | 41% | 21% |
| Maia.ai Ensemble | 42% | 40% | 18% |
| Elo + Dixon-Coles Model | 35% | 44% | 21% |
| AI Consensus (9 LLMs avg.) | 44% | 38% | 18% |
| Betfair Exchange (implied) | 46% | 36% | 18% |
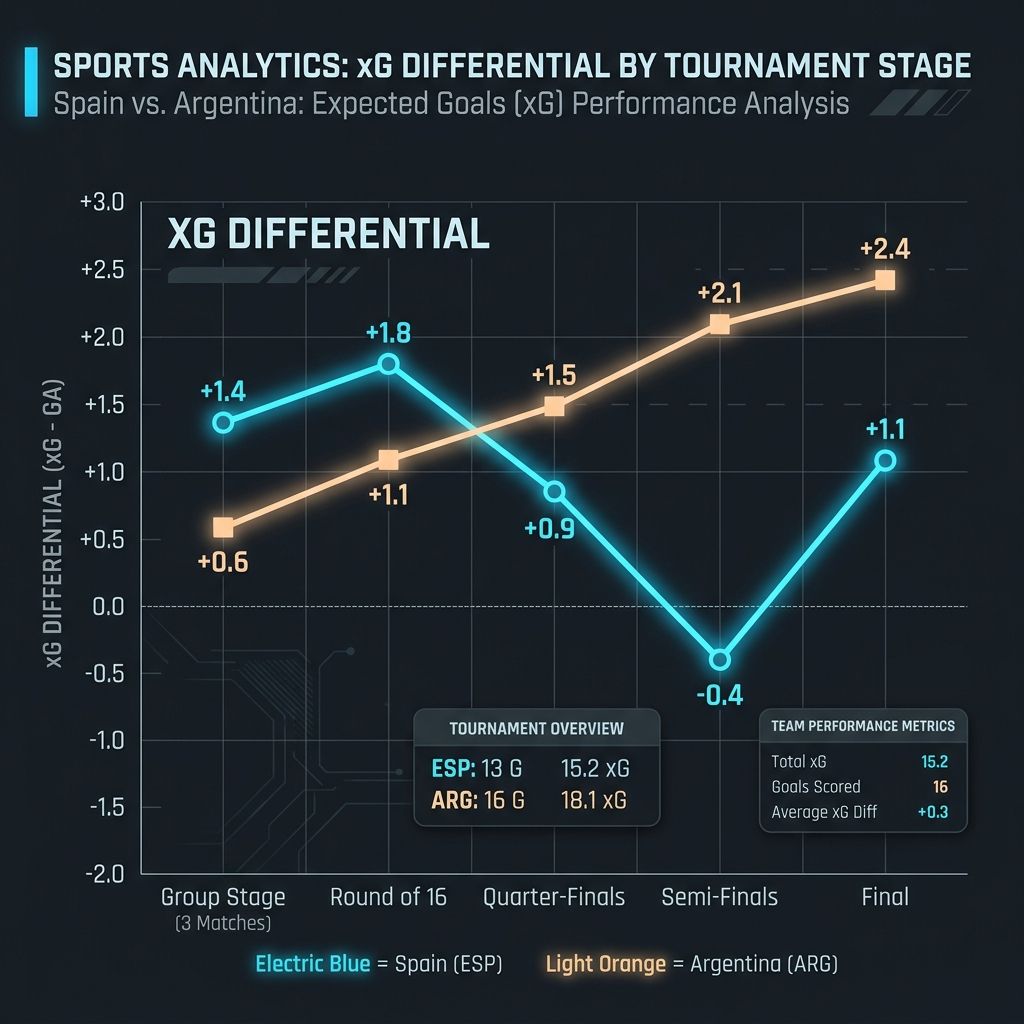
The statistical models favor Spain by a small margin. Their xG differential across the tournament (+8.3 net, vs. Argentina’s +6.1) reflects a team that doesn’t just win — they outplay opponents at a structural level. Pedri and Gavi’s control of the central press has reduced opponents to speculative, low-quality shooting throughout.
Argentina’s edge, according to the LLM consensus, is psychological and situational. They have more experience winning finals under pressure (2021 Copa América, 2022 World Cup). Their back four with Cristian Romero has conceded the fewest high-xG chances per 90 in the knockout rounds. And Messi, at his fourth World Cup, doesn’t appear in any Poisson distribution — his presence compresses probability curves that would otherwise look routine.
Where the Models Still Struggle: Fatigue, Pressure, and Chaos
Even the best models in 2026 carry one honest caveat: tournament football randomness is structurally underestimated.
The expanded 48-team format introduced more variance throughout the group stage, with more mismatches and fewer high-quality data points from elite matchups. When models trained on league data encounter a single-elimination bracket with limited sample sizes, their confidence intervals widen significantly.
Three factors the data struggles to price accurately:
- Squad fatigue curves. Both teams have played seven matches since June 12. Spain’s pressing system demands the highest average sprint distance per match at this World Cup (11.4 km per player). That number degrades in extra time.
- Penalty shootout randomness. Once the match goes to penalties, historical conversion rates (Argentina: 78%, Spain: 71% in major tournaments) apply, but individual mental state swings those odds by ±15% in either direction.
- Coaching adjustments. Scaloni (Argentina) and de la Fuente (Spain) are both tactically adaptive. Static pre-match models cannot account for halftime shape changes or substitution timing that can reshape xG trajectories in real time.
How Visual Data Tools Make These Models Accessible
Here’s where the gap between raw analytics and actual betting or viewing value sits — and it’s a significant gap.
Most casual fans don’t have access to a Dixon-Coles simulator or a Statsbomb xG feed. But increasingly, tools that visualize this data in digestible formats are changing that. The Pickviz model — used across pickviz.com — is a direct example of this philosophy in action. Rather than dumping raw probability tables onto readers, visual picks dashboards translate model outputs into clear, scannable formats: which side carries the structural advantage, where the value sits relative to market odds, and how the data distribution trends across similar historical matchups.
This matters for two reasons. First, it democratizes analysis that used to require a data science background. A fan who understands that Spain’s xG differential ranks them in the 94th percentile of all World Cup 2026 sides can make a better-informed viewing or wagering decision than one working purely off intuition. Second, visual models surface the range of outcomes — not just a single prediction — which is the honest way to communicate what probabilistic data actually says.
The World Cup 2026 final is genuinely too close to call on the numbers. But that’s the point. Knowing why it’s close, which variables could tip it either way, and where the market may be mispricing Argentina’s finishing pedigree — that’s the information advantage good data visualization hands you.
Final Thought: Data Doesn’t Pick Winners, It Narrows the Field
Argentina vs. Spain on July 19 at MetLife Stadium is a coin-flip framed by context. The models say Spain has a structural edge in xG quality and possession control. The LLMs and betting markets tilt slightly toward Argentina based on historical final performance and Messi’s variance compression.
What neither number tells you is that football’s greatest moments happen in the space between what the data predicts and what actually unfolds. The analytics exist to make you a smarter witness — not to eliminate the drama.
Run your simulations. Check the visual picks. Then watch.