Expected Assists (xA) Explained: Soccer’s Premier Metric
 Pickviz
8 min read
Pickviz
8 min read
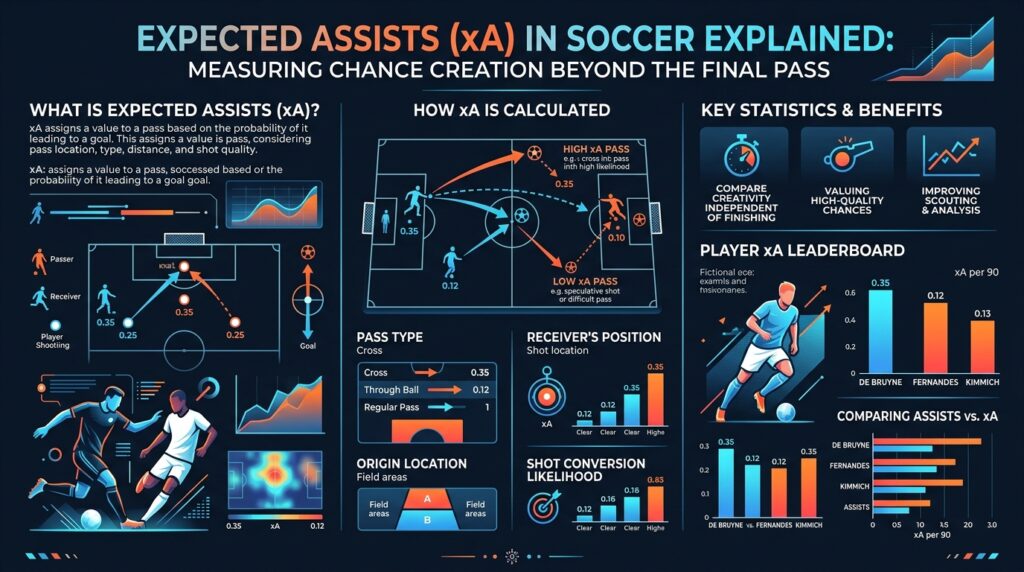
During the 2019–20 Premier League season, Kevin De Bruyne equaled Thierry Henry’s single-season record by recording 20 assists. Traditional box-score statistics credited De Bruyne with 20 goal-creating passes, treating every assist equally—from a 40-yard pinpoint through-ball splitting four defenders to a two-yard layoff before a teammate struck a 30-yard screamer into the top corner. More critically, traditional stats completely ignored the dozens of moments where De Bruyne carved open opposition defenses, only for his strikers to squander clear-cut scoring opportunities. Traditional assists measure the outcome of two distinct actions: the pass and the subsequent shot. By forcing the passer’s evaluation to depend entirely on the finisher’s execution, traditional metrics introduce extreme noise and finishing variance into playmaker evaluation.
Key Takeaways
- Definition: Expected Assists (xA) measures the likelihood that a given pass will lead directly to a goal, based on shot quality and historical completion factors.
- Isolation of Skill: xA isolates the passer’s creative output from the receiver’s finishing ability, solving the fundamental flaw of traditional assist tallies.
- Dual Frameworks: Shot-assisted xA isolates key passes leading directly to shots, while pass-based xA (and Expected Threat) evaluates pitch progression regardless of whether a shot occurs.
- Predictive Value: Underlying xA rates stabilize much faster over a 10-to-15 match sample than raw assist totals, making xA superior for performance forecasting and recruitment.
1. The Fundamental Flaw of Traditional Assist Metrics
In elite soccer analytics, raw assist counts represent one of the most volatile and misleading box-score figures. A pass only becomes an assist if the shot recipient converts the opportunity. This creates a statistical dependency chain where a passer’s official tally is heavily biased by teammate efficiency.
Consider a practical comparison: Midfielder A plays five low-driven passes across the six-yard box directly to an uncontained striker. Midfielder B plays five horizontal square passes 35 yards away from goal. If Midfielder A’s striker misses all five tap-ins while Midfielder B’s teammate scores five individual long-range goals, traditional box scores award Midfielder B five assists and Midfielder A zero. The traditional metric conflates conversion efficiency with chance creation quality. Expected Assists (xA) addresses this systemic flaw by assigning a probability score to every pass based on the objective threat created, independent of whether the ball crosses the goal line.
2. Defining Expected Assists: Mathematics and Methodology
Expected Assists quantifies the probability that a completed pass will become a goal assist. Depending on the data provider (such as Opta, StatsBomb, or Wyscout), xA is calculated through one of two primary analytical frameworks: Shot-Assisted xA and Pass-Based (Open-Play) xA.
Shot-Assisted xA Methodology
In shot-assisted models, xA is assigned retroactively to the final pass preceding a shot. The xA value of that pass is defined as exactly equal to the Expected Goals (xG) value of the resulting shot attempt. The xG of the shot accounts for spatial geometry, defensive pressure, body part, and play phase.
Mathematically, if $P_i$ represents a key pass delivered to player $i$, and $xG(S_i)$ represents the probability that shot $S_i$ results in a goal, then:
If a playmaker completes a key pass that sets up a central shot from 8 yards out with an xG of 0.45, the passer accumulates 0.45 xA. If the striker skies the ball over the crossbar, the passer retains the full 0.45 xA. Conversely, if a pass leads to a low-probability 30-yard shot with an xG of 0.02 that happens to hit the top corner, the passer receives only 0.02 xA, reflecting the true probability of that pass yielding a goal.
Pass-Based (Pre-Shot) xA Methodology
Advanced statistical models extend beyond shot-assisted events. Pass-based xA assigns a probability to every pass completed during open play, regardless of whether a shot is subsequently taken. These models use spatial tracking and event data to calculate the probability that a pass from point $(x_1, y_1)$ to point $(x_2, y_2)$ will eventually lead to a goal within a specific possession window.
Factors incorporated into multivariate logistic regression and machine learning models (such as XGBoost or Neural Networks) for pass-based xA include:
- Start and End Coordinates: Absolute position on the pitch relative to the opponent’s goal mouth.
- Pass Type and Trajectory: Ground pass, high cross, lobbed through-ball, or chipped pass.
- Pass Velocity and Distance: Linear distance covered and speed of ball movement.
- Game State and Phase: Open play, counter-attack, corner, free-kick, or throw-in.
- Defensive Structure: Number of opposition players bypassed by the pass (packing metrics) and proximity of pressuring defenders to the receiver.
3. Shot-Assisted xA vs. Open-Play Passing Models
Understanding the distinction between shot-assisted xA and non-shot spatial threat models (such as Expected Threat, or xT) is vital for tactical analysis. Each model serves a distinct analytical purpose.
Statistical Insight: Model Divergence
Shot-Assisted xA captures high-value final-third actions but suffers from selection bias: it ignores elite passes that put a teammate in a high-scoring position if that teammate chooses to pass rather than shoot. Non-shot models (xT and Pass-Based xA) eliminate selection bias by evaluating pitch progression across all build-up phases.
When evaluating deep-lying playmakers (such as Rodri, Sergio Busquets, or Toni Kroos), shot-assisted xA often underestimates their total impact. A deep-lying midfielder may break two defensive lines with a line-breaking vertical pass to a winger, who then makes an easy square pass to a striker for a shot. In this scenario, shot-assisted xA credits the winger with the high xA value, while the deep-lying playmaker receives zero xA under shot-assisted criteria. To capture build-up value, clubs utilize secondary metrics like Secondary xA (the pass before the key pass) and Expected Threat (xT) alongside primary xA.
4. Decoupling Playmaker Quality from Finishing Variance
Analyzing the delta between a player’s actual assists ($A$) and expected assists ($xA$) reveals critical insights into teammate finishing efficiency and statistical regression.
A positive delta ($\Delta A > 0$) indicates that a player’s passes were converted at a rate higher than the historical average of those shot locations. This suggests exceptional finishing by teammates or unsustainably high conversion luck. A negative delta ($\Delta A < 0$) indicates that teammates underperformed relative to the expected conversion rate of the chances created.
Elite European Playmakers Analysis
The table below illustrates sample data comparing elite creative midfielders across European leagues, demonstrating how xA decouples creative output from team finishing capabilities.
| Player | Primary Club | Key Passes / 90 | Actual Assists / 90 | xA / 90 | Delta (A – xA) | Primary Creative Zone |
|---|---|---|---|---|---|---|
| Kevin De Bruyne | Manchester City | 3.65 | 0.52 | 0.44 | +0.08 | Right Half-Space Crosses |
| Bruno Fernandes | Manchester United | 3.20 | 0.24 | 0.38 | -0.14 | Central Through-Balls |
| Thomas Müller | Bayern Munich | 2.85 | 0.48 | 0.36 | +0.12 | Penalty Area Cutbacks |
| Lionel Messi | PSG / Inter Miami | 3.10 | 0.45 | 0.42 | +0.03 | Central / Right Diagonal Chips |
| Trent Alexander-Arnold | Liverpool | 2.50 | 0.28 | 0.31 | -0.03 | Deep Overlap / Set Pieces |
Notice the case of Bruno Fernandes versus Kevin De Bruyne in specific sample seasons. Fernandes registered an xA per 90 rate of 0.38, yet his actual assist output lagged at 0.24 due to poor conversion by Manchester United forwards. Conversely, De Bruyne benefited from elite finishing (e.g., Erling Haaland), outperforming his underlying xA per 90 (0.44 xA vs 0.52 actual assists). Evaluating both players on raw assists alone would incorrectly suggest De Bruyne was twice as effective at creating chances, whereas xA demonstrates their underlying creative output was significantly closer.
5. Tactical Applications: How Analytics Departments Use xA
Modern sports analytics departments and recruitment teams use xA as a cornerstone metric across multiple domains:
Scouting and Recruitment
Recruitment analysts use xA to identify undervalued playmakers in lower-tier leagues or underperforming teams. A player generating 0.35 xA per 90 while playing for a struggling team with wasteful strikers will have a depressed raw assist tally. Buying clubs can acquire such players below market value before their assist totals inevitably regress upward to meet their underlying xA baseline when paired with superior finishers.
Tactical Blueprinting and Pitch Geometry
By mapping xA values to spatial origin zones on a pitch heat map, tactical analysts evaluate where a team’s high-value chance creation originates. The half-spaces—zones located between the central corridor and the wide flanks—consistently generate passes with higher xA values per pass attempt than traditional wide crosses. High-density xA visualization maps clearly show that low-driven cutbacks from the penalty area edge yield significantly higher xA values (0.15 to 0.40 xG per shot) compared to deep crosses outside the 18-yard box (0.02 to 0.05 xG per shot).
6. Strategic Outlook: The Evolution of Passing Metrics
As optical tracking data and computer vision mature, Expected Assists continues to evolve beyond event-based tracking. Next-generation xA models integrate real-time spatial positioning of off-ball defenders, passing lane width, and receiver velocity vectors. This enables real-time calculations of Pass Completion Probability combined with Value Added (VA), providing an even clearer picture of decision-making in high-pressure scenarios.
For analysts, sportsbooks, and tactical personnel, xA has redefined how chance creation is quantified. By isolating the creative passing action from finishing variance, Expected Assists provides an objective evaluation of playmaking quality across global soccer.
Frequently Asked Questions
Q1: What is the main difference between xG and xA?
Expected Goals (xG) measures the probability that a specific shot attempt will result in a goal. Expected Assists (xA) measures the probability that a pass will lead to a goal, typically equal to the xG of the resulting shot attempt, isolating the passer’s contribution from the shooter’s execution.
Q2: Does a player get xA if the receiver does not shoot?
In standard Shot-Assisted xA models, no xA is awarded if the receiver does not take a shot. However, in advanced Pass-Based xA or Expected Threat (xT) models, every pass is assigned a probability value based on pitch location and spatial progression, regardless of whether a shot attempt occurs.
Q3: Can xA be calculated for set pieces?
Yes. Set-piece xA evaluates corners and direct free-kick passes. Because set pieces occur under static defensive setups, models evaluate variables like delivery trajectory, drop zone, and attacker-to-defender density in the box.
Q4: Why can a player’s actual assists differ significantly from their xA over a season?
A gap between actual assists and xA is driven by finishing variance. If a passer’s teammates convert difficult, low-xG chances, actual assists will exceed xA. If teammates fail to convert clear tap-ins, actual assists will fall below xA. Over larger sample sizes, actual assists tend to regress toward the player’s cumulative xA baseline.